Essential Funnel Metrics to Refine Performance
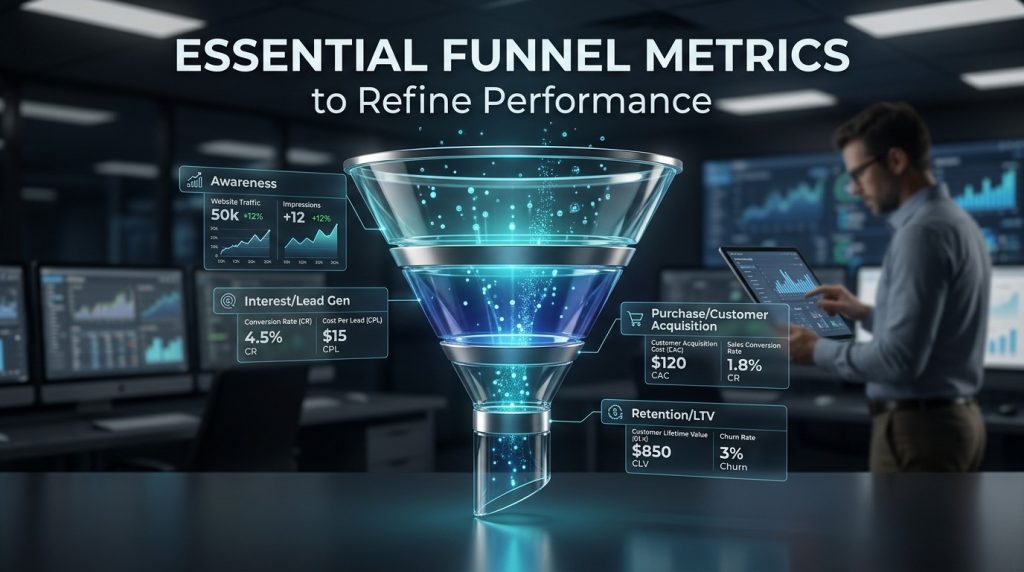
Strong funnel optimization starts with measurement. These Essential Funnel Metrics reveal where prospects hesitate, why conversions fall, and which improvements can create sustainable performance gains across journeys.
Traffic is visible, exciting, and easy to celebrate, but traffic alone does not explain business performance. A website can attract thousands of visitors while generating disappointing revenue, weak lead quality, or excessive acquisition costs. The real question is what happens after a person arrives, interacts, evaluates an offer, and decides whether to continue.
That is why Essential Funnel Metrics deserve attention. They transform a vague question such as “Why are conversions low?” into a sequence of measurable questions. Which stage loses the most users? How quickly do prospects move forward? Which channels generate serious buyers? Where does intent disappear? Which pages create confidence, and which create friction?
A mature measurement system does more than report numbers. It connects behavior to business outcomes. Instead of treating every decline as a marketing problem, teams can distinguish acquisition issues from landing-page issues, sales issues, pricing issues, and retention issues.
The most useful Essential Funnel Metrics also help marketers prioritize their effort. Without prioritization, teams often make cosmetic changes: adjusting button colors, rewriting headlines, or adding more traffic. With proper measurement, optimization becomes more rational. Teams can identify high-impact weaknesses, form hypotheses, test them, and compare results.
This approach matters because customers rarely move through a perfectly linear journey. People return later, switch devices, compare competitors, ask questions, discuss purchases internally, and abandon sessions before coming back. Measurement must therefore capture both immediate actions and broader journey patterns.
Understand the Funnel Before Measuring It
Before choosing dashboards, define the funnel itself. A funnel represents the progression from initial awareness to meaningful business action. Depending on the organization, the stages may include awareness, acquisition, engagement, consideration, conversion, activation, retention, and advocacy.
Essential Funnel Metrics become much more meaningful when each stage has a clear purpose. Awareness might focus on qualified reach. Acquisition may measure visits or leads. Engagement can examine meaningful interactions. Consideration can track product views, demos, pricing visits, or application starts. Conversion captures purchases or qualified sales opportunities.
For a B2B company, the funnel may begin with content consumption, progress toward resource downloads, move into meetings, become sales-qualified opportunities, and eventually produce closed revenue. For ecommerce, the journey can involve product discovery, product-page engagement, add-to-cart, checkout initiation, purchase, repeat purchase, and referral.
The mistake is assuming that one universal funnel model fits every business.
Build a Stage-by-Stage Measurement Map
Create a simple matrix that links each funnel stage to an outcome, a metric, and an owner.
| Funnel Stage | Primary Goal | Useful Measurement Area | Typical Owner |
|---|---|---|---|
| Awareness | Reach relevant prospects | Qualified visibility | Marketing |
| Acquisition | Attract appropriate users | Qualified sessions/leads | Marketing |
| Engagement | Create meaningful interaction | Engagement behavior | Marketing/Product |
| Consideration | Build buying intent | Product, pricing, demo behavior | Marketing/Sales |
| Conversion | Generate business value | Purchases or opportunities | Sales/Growth |
| Retention | Sustain customer value | Repeat usage/purchase | Customer Success |
| Advocacy | Encourage referrals | Referral behavior | Marketing/Customer Success |
The strongest Essential Funnel Metrics are not simply the metrics that are easiest to collect. They are the measurements that explain movement between stages.
Conversion Rate Is the Most Visible Metric
Conversion rate is often the first metric discussed because it expresses a simple relationship: how many users complete a desired action compared with the relevant audience.
For example:
Conversion Rate = Conversions ÷ Eligible Users × 100
A landing page receiving 10,000 eligible visitors and producing 300 conversions has a 3% conversion rate. The calculation is simple, but interpretation requires context.
Essential Funnel Metrics should always be analyzed in relation to the population being measured. A 5% conversion rate from highly qualified returning users may be less scalable than a 2% rate from a broad, high-intent acquisition channel. Likewise, a low rate might be acceptable for a high-consideration purchase if the resulting customers have strong lifetime value.
Conversion rate should therefore be segmented by source, campaign, device, geography, audience, landing page, new versus returning user, and customer type when data volume permits.
A sudden conversion-rate decline is also not automatically evidence that a page became worse. A campaign could have introduced lower-intent visitors. A price change could have altered buying behavior. A technical issue could have disrupted checkout. Measurement must consider the entire system.
Funnel Entry Volume Shows Demand Quality
Funnel entry volume measures how many people enter a specific stage. It can reveal whether performance changes are caused by demand, distribution, or downstream friction.
Suppose sales-qualified opportunities fall by 30%. The decline could be caused by fewer leads entering the funnel, a lower qualification rate, a weaker sales follow-up process, or a combination of factors.
Essential Funnel Metrics should therefore distinguish volume from quality. High lead volume can look impressive while producing little revenue. Conversely, a smaller number of leads can generate substantial value when qualification and intent are strong.
Useful entry-volume measurements include qualified website sessions, completed forms, product trials, demo requests, cart additions, and checkout starts.
Trend analysis is particularly useful. Compare current performance with previous periods, campaign baselines, channel benchmarks, and expected seasonality. Looking at one day or one week in isolation can create misleading conclusions.
Drop-Off Rate Reveals Where Intent Disappears
A funnel becomes actionable when you can see where users stop progressing.
Drop-off rate measures the proportion of users who enter a stage but do not move to the next meaningful step. A high drop-off rate can indicate friction, confusion, low intent, poor messaging alignment, unexpected cost, trust concerns, or technical problems.
Essential Funnel Metrics become significantly more useful when drop-off is interpreted alongside user behavior. For example, a checkout abandonment rate might increase after shipping charges appear. A demo form might lose users because the form requests too much information. A pricing page may cause exits because the offer is difficult to understand.
The goal is not to eliminate every drop-off. Some abandonment is healthy because unqualified users should leave. The objective is to reduce unnecessary abandonment among prospects who are capable of becoming valuable customers.
Separate Healthy and Unhealthy Drop-Off
Ask three questions:
- Who is dropping out?
- At what exact interaction does the drop occur?
- What changed immediately before the drop?
These questions prevent teams from blindly optimizing for volume.
Stage-to-Stage Conversion Is More Diagnostic Than Overall Conversion
Overall conversion tells you the final outcome. Stage-to-stage conversion explains the journey.
Consider a funnel that looks like this:
Visitors → Product Views → Cart → Checkout → Purchase
Suppose 100,000 visitors generate 20,000 product views, 5,000 carts, 3,000 checkouts, and 1,500 purchases.
The overall visitor-to-purchase rate is 1.5%. That matters, but the more useful insight may be elsewhere. Perhaps product-view-to-cart conversion is unusually weak, indicating positioning or product-page problems. Perhaps checkout-to-purchase is excellent, showing that payment flow is healthy.
Essential Funnel Metrics should be reviewed as a chain rather than as isolated percentages.
A useful stage conversion formula is:
Stage Conversion Rate = Users Advancing to Next Stage ÷ Users Entering Current Stage × 100
When every transition is measured consistently, you can identify the exact point where improvement could generate the most incremental value.
Cost Per Acquisition Connects Marketing to Economics
A funnel cannot be considered successful simply because it converts. It must convert economically.
Cost per acquisition, or CPA, helps determine how much the company spends to generate a desired customer or action.
CPA = Total Acquisition Spend ÷ Number of Acquisitions
Essential Funnel Metrics should connect CPA with conversion quality, customer value, and channel performance. A campaign with a cheap CPA may be less profitable if it produces low-retention customers. Another campaign with a higher CPA may be more attractive if customers generate substantially more lifetime value.
This is where channel-level segmentation becomes critical.
Compare organic search, paid search, social media, referral traffic, email, partnerships, direct traffic, and outbound activity. Then evaluate acquisition costs together with conversion rate and downstream revenue.
A channel that appears expensive at the lead stage may become efficient after sales qualification. Conversely, a cheap lead source can become inefficient when sales teams spend significant time handling poor-fit prospects.
Customer Acquisition Cost Must Be Evaluated With Lifetime Value
Customer acquisition cost, or CAC, measures what it takes to acquire a customer across relevant sales and marketing expenses. CAC becomes strategically important when compared with customer lifetime value.
Essential Funnel Metrics should not stop at the first transaction. A customer can initially generate modest revenue while becoming highly valuable over time through renewals, repeat purchases, upgrades, cross-sells, and referrals.
A simple LTV framework may consider average purchase value, purchase frequency, gross margin, and retention period. More sophisticated businesses can use cohort-based revenue and contribution margin models.
The relationship between CAC and LTV helps answer a powerful question: is growth economically sustainable?
For example, rapidly increasing acquisition spend may produce more customers but weaken profitability if customer value remains flat. Conversely, improving onboarding, retention, or upsell can increase LTV without requiring more acquisition volume.
Measurement therefore needs to look beyond the first conversion.
Time-to-Conversion Shows Funnel Friction
Not every customer converts immediately. Time-to-conversion measures how long it takes users to move from an initial meaningful interaction to a desired outcome.
Essential Funnel Metrics should include time-to-conversion for products where consideration takes longer. A B2B service, enterprise software platform, education program, or high-ticket product may have a fundamentally different conversion timeline than a low-cost ecommerce product.
Analyze median time rather than relying only on averages, because a small number of extreme cases can distort the mean.
Segment time-to-conversion by source, audience, product, deal size, and customer type.
If one channel consistently produces faster conversions and comparable customer value, it may deserve greater investment. If conversion time suddenly increases, possible causes include pricing concerns, additional approval requirements, weaker follow-up, changing market conditions, or increased competition.
Reducing time-to-conversion does not mean pressuring customers. The smarter objective is reducing unnecessary delay by removing uncertainty and friction.
Lead-to-Customer Conversion Measures Lead Quality
A high lead-generation rate does not guarantee business growth. The critical question is how many leads become customers.
Lead-to-customer conversion is especially valuable for businesses with sales teams because it connects marketing activity with revenue outcomes.
Essential Funnel Metrics should distinguish raw leads, marketing-qualified leads, sales-qualified leads, opportunities, proposals, and closed customers when those stages exist.
This helps uncover bottlenecks. If marketing generates substantial lead volume but sales-qualified conversion is weak, targeting or messaging may need adjustment. If qualified opportunities are strong but closed-won performance is weak, the issue may be pricing, sales execution, product-market fit, or competitive positioning.
A shared definition of each lifecycle stage is essential. Without consistent definitions, teams can manipulate metrics unintentionally or interpret the same funnel differently.
Average Order Value Adds Financial Context
Average order value, or AOV, measures the typical amount spent per transaction.
AOV = Total Revenue ÷ Number of Orders
Essential Funnel Metrics should include AOV when increasing revenue through better merchandising, bundles, cross-sells, or upsells is strategically relevant.
Imagine two stores with identical purchase conversion rates. One generates an average order of $40 while another generates $85. The second may be significantly more resilient to acquisition costs.
AOV can also be segmented by channel, product category, customer type, campaign, and device. These comparisons may reveal unexpected opportunities.
For example, mobile users may convert slightly less frequently but have strong AOV when they do purchase. That could justify improving mobile merchandising rather than simply trying to match desktop conversion rates.
Cart and Checkout Abandonment Require Behavioral Analysis
Ecommerce funnels often suffer from abandonment after intent has already become strong.
Cart abandonment can happen because customers are comparing options, reconsidering price, checking alternatives, or postponing purchase. Checkout abandonment is often more serious because users have advanced further in the process.
Essential Funnel Metrics should distinguish cart abandonment from checkout abandonment rather than combining them.
Monitor shipping-cost exposure, payment failures, coupon behavior, required account creation, delivery expectations, mobile usability, and form completion.
When abandonment increases, investigate changes to the experience before assuming customers simply became less interested.
Common improvements include clearer cost communication, fewer checkout fields, more payment choices, stronger reassurance, transparent returns information, and better error handling.
Engagement Metrics Need Context
Engagement metrics can be useful, but they are easy to misinterpret.
Time on page, scroll depth, page views, video plays, and click activity can indicate interest, yet high engagement does not necessarily produce revenue.
Essential Funnel Metrics should connect engagement to progression. A user reading six articles without ever viewing a relevant product page may be interested but not ready to buy. Another visitor may spend less time on the site but immediately request a demo.
Use engagement as supporting evidence rather than the final definition of success.
The most valuable behavioral events are often those that demonstrate intent: comparing products, viewing pricing, interacting with calculators, downloading decision-stage assets, starting applications, scheduling calls, or beginning checkout.
Funnel Velocity Helps Forecast Growth
Funnel velocity measures how quickly qualified opportunities progress through a business process.
A simplified model can consider:
Qualified Opportunities × Average Deal Value × Win Rate ÷ Sales Cycle Length
Essential Funnel Metrics gain strategic value when velocity is tracked alongside pipeline quality. A company can increase revenue without dramatically increasing traffic if it improves the rate and speed at which qualified opportunities become customers.
For sales-led organizations, velocity can uncover whether opportunities are accumulating in one stage. Too many old opportunities may indicate weak qualification or stalled decision-making.
Marketing and sales teams should review velocity together because content, lead nurturing, messaging, and follow-up can all influence movement.
Retention Is Part of the Funnel, Not an Afterthought
Many teams end their funnel analysis when someone purchases. That creates an incomplete view.
Retention measures whether customers continue using, buying, subscribing, or engaging with the business.
Essential Funnel Metrics should therefore extend beyond acquisition into activation, retention, renewal, and expansion. A company that acquires aggressively but loses customers quickly may have a serious funnel problem disguised as a growth problem.
Track repeat purchase rate, renewal rate, churn, activation milestones, product usage, support interactions, and customer health indicators.
Retention data can also improve acquisition. If you discover that customers from one acquisition source retain significantly better than customers from another, that insight should influence budget allocation and targeting.
The best funnels do not merely create customers. They create customers who receive enough value to remain customers.
Cohort Analysis Reveals Hidden Performance Patterns
Averages can conceal important differences. Cohort analysis groups customers by a shared starting point such as acquisition month, source, campaign, product, or signup period.
Essential Funnel Metrics become more powerful when viewed through cohorts because you can compare similar groups over time.
For example, one customer cohort might show strong first-month activation but poor long-term retention. Another may have slower initial activity but much higher six-month value.
Cohort analysis can reveal whether improvements are genuinely working. If a new onboarding process is introduced in April, compare April cohorts against earlier cohorts rather than relying only on an overall company average.
This approach also helps identify seasonality. A high conversion period may be caused by market demand rather than an optimization campaign.
Segment Your Funnel Instead of Trusting One Average
A single funnel average can hide major differences between audiences.
Essential Funnel Metrics should be segmented by device, traffic source, campaign, geography, customer type, product, funnel entry point, and new versus returning users where sample size allows.
Suppose overall conversion is 2.5%. That number could hide 4% desktop conversion, 1.2% mobile conversion, 5% branded-search conversion, and 0.8% generic-paid-search conversion.
The average is mathematically accurate but strategically incomplete.
Segmentation is most useful when it leads to different decisions. Do not create hundreds of segments simply because the analytics platform allows it. Focus on meaningful groups where behavior, intent, value, or experience differs.
Fixing Funnel Leaks Requires Root-Cause Thinking
When performance declines, many teams immediately search for the weakest percentage. That is useful, but it is only the starting point.
Fixing Funnel Leaks requires understanding why the weak stage is underperforming. A low conversion rate might result from poor message-market alignment, pricing resistance, technical errors, lack of trust, weak offers, or mismatched traffic.
Essential Funnel Metrics help isolate the symptom, while qualitative evidence explains the cause.
Combine analytics with session recordings, surveys, customer interviews, sales-call notes, search behavior, support tickets, and usability testing.
Then formulate a clear hypothesis:
“Qualified mobile visitors abandon the checkout because the delivery cost is revealed too late.”
That is a stronger optimization hypothesis than:
“Mobile conversion is low.”
The first statement identifies an audience, an experience, a suspected cause, and a potential intervention.
Use Essential Funnel Metrics to Prioritize Experiments
Not every problem deserves an experiment.
Prioritize opportunities using potential impact, confidence, effort, and strategic importance.
Essential Funnel Metrics should help identify where a small improvement could generate meaningful incremental revenue or pipeline.
A practical prioritization framework can consider:
| Factor | Key Question |
|---|---|
| Impact | How much business value could change? |
| Reach | How many qualified users experience the problem? |
| Confidence | How strong is the evidence? |
| Effort | How difficult is the solution? |
| Speed | How quickly can learning occur? |
A high-impact problem affecting thousands of qualified users should generally receive more attention than a minor issue affecting a small audience.
The objective is not to run more experiments. The objective is to create more learning from each experiment.
Essential Funnel Metrics and A/B Testing
A/B testing provides a controlled way to compare alternatives, but testing only matters when the hypothesis is tied to measurable behavior.
Suppose the hypothesis is:
“Reducing the number of form fields will increase qualified demo submissions without reducing lead quality.”
Essential Funnel Metrics should include not only form completion but also downstream indicators such as qualification rate, meeting attendance, opportunity creation, and eventual revenue when possible.
Otherwise, a test might appear successful because more low-quality leads enter the funnel.
Testing also requires adequate sample size, clean measurement, a defined primary outcome, and enough time to avoid misleading conclusions.
Do not declare a winner because one variant performs slightly better after a few hours. Data quality is more valuable than speed theater.
Essential Funnel Metrics for Landing Pages
Landing pages sit at a critical intersection between acquisition and conversion.
Useful measures include qualified visits, engagement with the core offer, CTA interaction, conversion rate, form completion, bounce behavior, and downstream quality.
Essential Funnel Metrics should be connected to traffic intent. A landing page designed for informational search traffic may naturally convert differently from one designed for high-intent paid search traffic.
Message consistency is crucial. If an ad promises a specific benefit but the landing page presents a broad or different message, users may experience cognitive friction.
Strong landing-page optimization generally improves clarity, relevance, trust, proof, offer comprehension, and ease of action.
Essential Funnel Metrics for Paid Campaigns
Paid media performance cannot be judged solely through clicks or impressions.
Measure qualified traffic, cost per qualified visit, conversion rate, CPA, revenue, contribution margin, and post-conversion quality.
Essential Funnel Metrics should be evaluated at campaign, ad-group, keyword, creative, and audience levels when the available data supports those comparisons.
High click-through rates can be misleading. A compelling ad may generate curiosity without creating purchase intent. The most valuable campaigns are those that align attention with commercial value.
Also monitor landing-page consistency and post-click behavior. Paying for traffic only to lose most users at the landing-page stage wastes acquisition spend.
Essential Funnel Metrics for Email and Nurture
Email funnels require more than opens and clicks.
Track delivered messages, clicks, engaged sessions, conversions, unsubscribes, qualified actions, and downstream revenue.
Essential Funnel Metrics can help identify whether a nurture sequence accelerates movement or simply creates more activity.
For example, email engagement may appear strong while lead-to-opportunity conversion remains unchanged. That indicates the emails may be entertaining rather than decision-supportive.
Effective nurture content should reduce uncertainty, educate prospects, reinforce relevance, answer objections, and make the next step obvious.
Essential Funnel Metrics for Outreach
Outbound campaigns create another measurement challenge because volume can become the dominant focus.
A strong outbound measurement system should monitor contact quality, response rate, positive-response rate, meetings booked, show rate, qualified opportunities, win rate, revenue generated, and acquisition cost.
Essential Funnel Metrics prevent outreach teams from celebrating activity that does not create business value.
A useful distinction is between response and positive response. A reply saying “not interested” is not equivalent to a reply requesting a meeting.
For companies using a High Converting Outreach Strategy, downstream measurement matters even more. The strategy should optimize for quality conversations and revenue outcomes rather than message volume alone.
Essential Funnel Metrics and AI-Assisted Marketing
AI can accelerate research, content production, segmentation, experimentation, and analysis, but measurement discipline remains essential.
Essential Funnel Metrics should be used to determine whether AI-supported campaigns actually improve business outcomes rather than merely increasing production speed.
This distinction matters in content marketing. Automated content can increase publishing frequency while failing to improve qualified traffic. A team focused on performance should measure traffic quality, engagement with decision-stage content, assisted conversions, lead quality, and revenue contribution.
As AI-generated materials become more common, marketers may also use AI Content Detection in their quality-control workflows. However, the ultimate evaluation should remain centered on usefulness, originality, audience relevance, accuracy, and performance rather than relying on a single detection signal.
AI Should Help Interpretation, Not Replace Judgment
Modern analytics systems can process enormous amounts of behavioral data. AI can summarize trends, detect unusual movements, classify feedback, identify correlations, and support forecasting.
Essential Funnel Metrics become easier to explore when analysts can ask natural-language questions such as:
“Which acquisition channels have the highest qualified conversion rate?”
“Which pages show the biggest week-over-week decline?”
“Which customer cohorts retain the best after six months?”
“Which devices show unusual checkout abandonment?”
AI can accelerate these investigations, but humans still need to validate data quality and causal assumptions.
For content teams, an AI Blogging Overview may help explain how generative systems can support ideation, research, drafting, optimization, and distribution. Yet content performance still requires human judgment, audience understanding, and reliable measurement.
Build a Funnel Dashboard That Encourages Action
A dashboard should answer questions, not simply display numbers.
Essential Funnel Metrics should be arranged according to business decisions. Start with the primary outcome, then show the major funnel stages that influence it.
A practical dashboard structure could include:
| Dashboard Area | Recommended Focus |
|---|---|
| Business Outcome | Revenue, customers, qualified opportunities |
| Acquisition | Qualified traffic, leads, acquisition cost |
| Engagement | Intent signals and meaningful actions |
| Conversion | Stage-to-stage and final conversion |
| Efficiency | CPA, CAC, funnel velocity |
| Retention | Repeat activity, churn, renewals |
| Diagnostics | Drop-off, anomalies, technical issues |
| Segmentation | Channel, device, audience, cohort |
Avoid filling every available dashboard space. When too many metrics compete for attention, teams lose the ability to identify what matters.
Watch for Measurement Errors
Bad data can produce confident but incorrect decisions.
Essential Funnel Metrics are only useful when tracking is reliable. Common problems include duplicated events, missing conversions, inconsistent UTM parameters, broken cross-domain tracking, attribution gaps, bot traffic, cookie limitations, and mismatched definitions.
Establish a measurement governance process.
Document what each event means. Define when a conversion occurs. Standardize naming conventions. Audit tags regularly. Compare analytics-platform data with backend or CRM records when possible.
Unexpected changes should trigger a measurement check before they trigger a marketing overhaul.
Avoid Vanity Metrics
Vanity metrics make performance look impressive without explaining business impact.
Impressions, raw followers, total page views, and traffic volume can have strategic value, but they should not dominate decision-making.
Essential Funnel Metrics should emphasize measurements connected to customer behavior and business outcomes.
A metric is more useful when a team can answer three questions:
What changed?
Why did it change?
What action should we take?
When a number cannot support a meaningful decision, it may belong lower in the reporting hierarchy.
Turn Metrics Into a Continuous Optimization Loop
The most sophisticated funnel systems operate as learning loops.
First, measure baseline behavior. Second, identify meaningful friction. Third, develop a hypothesis. Fourth, implement a controlled improvement. Fifth, evaluate results. Sixth, document the learning. Seventh, apply the insight to other relevant stages.
Essential Funnel Metrics provide the evidence throughout this cycle.
For example:
Baseline conversion: 2.1%
Identified issue: high mobile checkout abandonment
Hypothesis: payment friction is causing qualified users to leave
Experiment: simplify payment selection
Result: checkout completion increases
Next step: test the same principle across related purchase flows
This process creates compounding gains. A one-percentage-point improvement at several funnel stages can produce a significant overall effect because improvements multiply across the journey.
Essential Funnel Metrics for Executive Decision-Making
Executives rarely need every analytical detail. They need to know whether growth is efficient, sustainable, and predictable.
Essential Funnel Metrics should therefore be translated into business questions.
Are we acquiring enough qualified demand?
Are acquisition costs increasing?
Are conversion rates improving?
Where is the largest bottleneck?
Are customers generating enough value?
Is retention strengthening?
Which channels deserve additional investment?
Which problems require immediate intervention?
A strong executive dashboard connects funnel movement to revenue, margin, pipeline, and strategic priorities.
The purpose is not to create another reporting ritual. It is to help leadership allocate resources with greater confidence.
Create a Practical Weekly Funnel Review
A weekly funnel review can be extremely effective when structured around decisions rather than presentations.
Start with the primary business outcome. Review major funnel-stage movement. Investigate significant anomalies. Compare segments. Review experiments. Select the highest-priority improvement opportunity.
Essential Funnel Metrics should form the foundation of this meeting, while qualitative insights provide context.
Do not spend the entire session reading numbers that everyone can see in the dashboard.
Instead, ask:
What changed?
What is the most credible explanation?
What evidence supports that explanation?
What should we test next?
Who owns the action?
This converts measurement into accountability.
Essential Funnel Metrics and Long-Term Growth
Funnel optimization should not become a never-ending search for tiny conversion improvements.
Essential Funnel Metrics are most powerful when they reveal structural opportunities.
Sometimes the best improvement is not a new CTA or landing-page variation. It may be better audience targeting, clearer positioning, stronger onboarding, a simpler product, faster sales follow-up, better pricing communication, or a more compelling value proposition.
Measurement tells you where to investigate. Strategy determines what to change.
The companies that consistently improve are usually not the ones with the largest dashboards. They are the ones that combine disciplined measurement with strong customer understanding.
A Complete Funnel Measurement Framework
A practical measurement framework can be summarized across six layers:
Layer 1: Acquisition
Measure qualified traffic, source performance, campaign economics, and acquisition cost.
Layer 2: Engagement
Measure meaningful interactions, intent signals, content progression, and product exploration.
Layer 3: Consideration
Measure pricing visits, product comparisons, demos, applications, and other buying signals.
Layer 4: Conversion
Measure stage progression, conversion rates, purchase behavior, qualified opportunities, and revenue.
Layer 5: Retention
Measure activation, repeat purchases, renewals, churn, and customer value.
Layer 6: Expansion
Measure upsells, cross-sells, referrals, and advocacy.
Essential Funnel Metrics should be assigned across all six layers so the organization understands not only how customers enter the funnel, but how value develops after conversion.
Essential Funnel Metrics Checklist
Before launching or optimizing a funnel, confirm that you can answer these questions:
Do we know the major funnel stages?
Does each stage have a clearly defined success event?
Are stage-to-stage transitions measurable?
Can we identify major drop-off points?
Can we segment by channel and audience?
Can we connect leads with downstream revenue?
Do we understand acquisition economics?
Can we measure retention?
Are experiments tied to business outcomes?
Is tracking regularly audited?
Essential Funnel Metrics should make these answers accessible without requiring hours of manual analysis.
How to Prioritize What to Fix First
When several funnel problems appear at once, begin with the stage that combines high traffic, strong intent, significant leakage, and meaningful business value.
For example, improving a low-traffic page by 20% may produce fewer additional customers than improving a high-traffic checkout transition by 5%.
Essential Funnel Metrics allow you to estimate opportunity size instead of optimizing based on personal preference.
A simple opportunity estimate can consider:
Users affected × current conversion rate × expected improvement × customer value
This is not a perfect forecast, but it creates a rational basis for prioritization.
Build a Culture of Measurement
Technology alone does not create a measurement-driven organization.
Teams need shared definitions, trustworthy reporting, clear ownership, and permission to learn from experiments that fail.
Essential Funnel Metrics should become part of everyday decision-making rather than a reporting exercise performed at the end of the month.
Marketing should understand downstream sales outcomes. Sales should understand lead sources and customer behavior. Product teams should understand activation and retention. Leadership should understand economics and strategic trade-offs.
When everyone speaks the same measurement language, optimization becomes faster and more coordinated.
The Human Side of Funnel Performance
Numbers describe behavior, but customers create the numbers.
Essential Funnel Metrics become more powerful when marketers remember that every data point represents a person making a decision under uncertainty.
People hesitate when they feel confused. They abandon when they feel friction. They delay when they lack trust. They compare when value is unclear. They convert when the perceived benefit, confidence, and convenience outweigh the perceived risk.
That is why human psychology should sit beside quantitative measurement.
Ask what customers may be thinking at each stage:
“Is this relevant to me?”
“Can I trust this company?”
“Is this worth the price?”
“What happens if I change my mind?”
“Is this easier than my current solution?”
The answers to those questions often explain the patterns in the dashboard.
From Reporting to Revenue Improvement
The ultimate purpose of measurement is action.
Essential Funnel Metrics should help teams move from “Here is what happened” to “Here is what we should do next.”
That shift requires discipline. Teams need to distinguish correlation from causation, short-term gains from durable improvements, and activity from value.
The strongest optimization programs combine quantitative evidence, qualitative research, controlled experimentation, clear prioritization, and continuous learning.
When these elements work together, the funnel becomes more than a visualization. It becomes a management system for improving customer experience and business economics.
Conclusion
Essential Funnel Metrics turn complex customer journeys into measurable decisions. By tracking acquisition, engagement, stage conversion, drop-off, cost, velocity, retention, and customer value, businesses can identify weaknesses with greater precision. The real advantage comes from connecting every metric to a question, hypothesis, and action. Rather than chasing traffic or vanity numbers, teams can prioritize the stages where improvement creates meaningful commercial impact. Reliable tracking, segmentation, qualitative research, experimentation, and continuous review make optimization sustainable. A well-measured funnel does not simply explain performance; it creates a repeatable system for learning, improving customer experiences, increasing efficiency, and producing healthier long-term growth.
Frequently Asked questions (FAQ)
1. What are Essential Funnel Metrics?
Essential Funnel Metrics are the measurements used to understand how prospects move through a marketing or sales funnel. They typically cover acquisition, engagement, consideration, conversion, retention, and expansion. Important examples include conversion rate, drop-off rate, CPA, CAC, funnel velocity, lead-to-customer conversion, average order value, retention, and customer lifetime value.
2. Why are funnel metrics important for marketing performance?
Funnel metrics show where customer journeys succeed and where they break down. Traffic and impressions can demonstrate exposure, but funnel measurements explain whether that exposure produces meaningful behavior. They help marketers identify bottlenecks, allocate budgets, prioritize experiments, improve customer experiences, and connect marketing activity with business outcomes.
3. Which funnel metric should businesses track first?
Start with the primary business outcome and then work backward through the funnel. For ecommerce, that may be purchases and revenue. For B2B organizations, it may be qualified opportunities or closed revenue. After defining the final outcome, measure the major stages that directly influence it.
4. How do Essential Funnel Metrics help identify conversion problems?
They allow marketers to compare each transition between stages. Instead of seeing only a low final conversion rate, the team can identify whether the biggest problem occurs between landing-page engagement and product exploration, product exploration and cart activity, or checkout and purchase. Additional qualitative evidence can then help determine the root cause.
5. How often should funnel metrics be reviewed?
Review frequency depends on business volume. High-volume ecommerce and advertising programs may benefit from daily monitoring with weekly analysis. B2B funnels with longer sales cycles may require weekly or biweekly reviews and deeper monthly cohort analysis. The important principle is consistent review, not constant dashboard checking.
6. What is the difference between conversion rate and funnel velocity?
Conversion rate measures the percentage of users who move from one stage to another or complete a desired action. Funnel velocity measures how quickly qualified opportunities progress through the process while considering factors such as opportunity volume, deal value, win rate, and sales-cycle length. Both describe performance from different angles.
7. Can AI improve funnel analysis?
Yes. AI can assist with anomaly detection, segmentation, forecasting, customer-feedback analysis, pattern recognition, and natural-language reporting. However, AI should support rather than replace analytical judgment. Teams still need reliable data, clear definitions, appropriate context, and human review before making important strategic decisions.
8. Should every business use the same funnel metrics?
No. The ideal measurement framework depends on the business model, buying journey, customer behavior, sales cycle, and strategic objectives. An ecommerce retailer, SaaS company, agency, marketplace, and local service business may require different stage definitions and success events. The framework should reflect how customers actually create value.
9. How can businesses avoid being overwhelmed by too many metrics?
Create a measurement hierarchy. Begin with one primary business outcome, then identify the few funnel stages that most strongly influence it. Use secondary metrics for diagnosis rather than giving every metric equal importance. A smaller dashboard with clear relationships is usually more useful than a large dashboard full of disconnected numbers.
10. What is the biggest mistake companies make when using funnel metrics?
The biggest mistake is treating metrics as answers instead of clues. A low conversion rate identifies a problem area, but it does not automatically explain the cause. Strong optimization combines Essential Funnel Metrics with customer research, technical validation, segmentation, experimentation, and business context. The goal is not simply to improve a number; it is to improve the underlying customer journey and commercial outcome.