Harnessing Interactive Content for High-Response Outbound Marketing Campaigns

Revolutionizing Outbound Marketing with Interactive Elements
Introduction
Capturing the attention of busy buyers has never been more challenging. According to a 2023 report by Gartner, an average business professional receives over 150 emails each day and spends less than 15 seconds on any promotional message. Static banners, one-way newsletters, and cold-call scripts are quickly becoming background noise. To cut through this clutter and forge genuine two-way conversations, marketers are turning to interactive content. By inviting prospects to click, choose, calculate, or converse, you transform passive recipients into engaged participants. This post explores a tactical framework—from psychology and planning through design, distribution, automation, measurement, and compliance—to help you architect interactive outbound campaigns that drive higher response rates, richer data, and stronger customer relationships.
The Neuroscience of Engagement
Why does a short quiz or calculator outperform a static PDF? The answer lies in our brain’s reward pathways. Each time a person takes an action—answering a question, dragging a slider, or watching a branching video scene—dopamine levels rise, reinforcing the behavior. Research published in the Harvard Business Review (https://hbr.org/2020/02/the-power-of-interactive-content) indicates that interactive experiences can double user dwell time compared with non-interactive formats. Longer dwell time not only increases brand recall but also offers precious opportunities to collect insights into preferences, pain points, and purchase readiness. In short, interactivity turns outbound marketing from a broadcast into a conversation, triggering cognitive engagement and emotional investment.
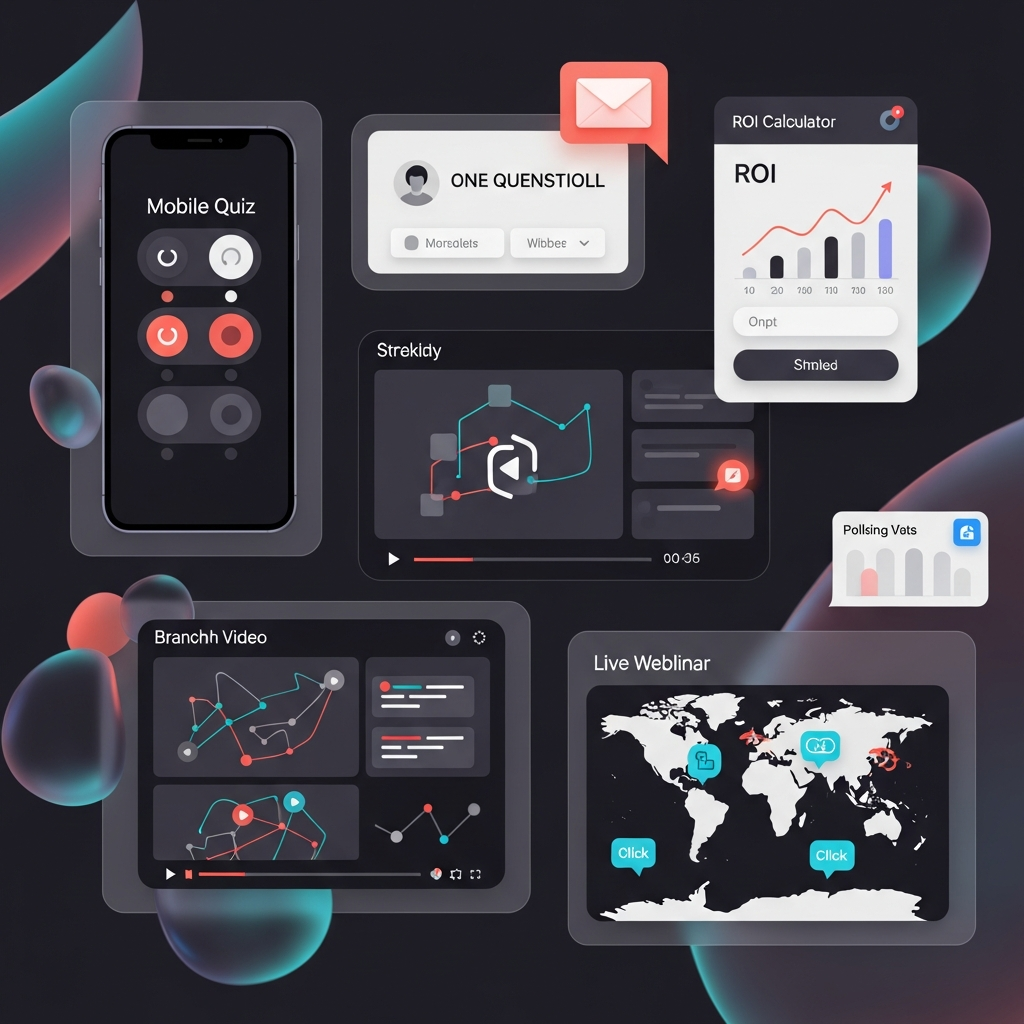
A Catalog of Interactive Tools
1. Quizzes & Assessments
- Purpose: Profile prospects, uncover maturity levels, or surface pain points.
- Example: “What’s Your E-Commerce Readiness Score?” with 5–7 questions and a customized report delivered by email.
- Data Value: Captures direct answers on preferences, budgets, and timelines.
2. Polls & Micro-Surveys
- Purpose: Elicit quick opinions or benchmark industry trends.
- Example: A one-question poll embedded in an email asking, “Which marketing channel drives most ROI?”
- Data Value: High participation rates (up to 60% completion vs. 20% for long surveys) according to SurveyMonkey (https://www.surveymonkey.com/mp/interactive-content/).
3. ROI & Savings Calculators
- Purpose: Quantify potential cost savings or revenue upside from adopting your solution.
- Example: A web-based tool that asks for monthly ad spend, then outputs an estimated 15–25% uplift in conversion rates.
- Data Value: Provides both qualification data (budget size) and persona signals (marketing vs. finance).
4. Interactive Video Experiences
- Purpose: Immerse prospects in real-world scenarios where they choose the narrative path.
- Example: A software demo that asks, “Would you like to see analytics or workflow features next?”
- Data Value: Click-through data reveals feature interests and buying stage.
5. Live Webinars & Virtual Workshops
- Purpose: Enable real-time Q&A, polls, and breakout sessions.
- Example: A 30-minute product deep dive with two interactive polls and a live chat moderated by product experts.
- Data Value: Attendance metrics, question transcripts, and engagement drop-off points.
6. Clickable Infographics & Interactive White Papers
- Purpose: Unpack complex data sets through maps, timelines, and charts that animate on hover or click.
- Example: An interactive map showing regional renewable energy adoption rates with drill-down data per state (source: US Department of Energy, https://www.energy.gov/).
Strategic Planning: From Goals to KPIs
- Define Clear Objectives
Awareness vs. Demand Gen vs. Pipeline Acceleration.
Example KPI: Increase MQL count by 30% in Q3 using a diagnostic quiz. - Map Buyer Personas & Journeys
Align content formats with persona preferences: tech-savvy marketers may relish calculators; C-suite executives prefer concise assessment results.
Journey Mapping: Outline each touchpoint—email teaser ➔ landing page quiz ➔ personalized report ➔ sales follow-up call. - Select Appropriate Channels
Email, social lead-gen ads (LinkedIn, Facebook), direct mail with QR codes, paid search.
Multi-channel Push: Coordinate week-long drip sequences to reinforce the interactive asset. - Allocate Resources & Timelines
Tools: Third-party platforms (Outgrow, Ceros, Typeform) vs. in-house development.
Timeline: 6 weeks from ideation to launch including research, design, testing, and integration. - Establish Success Metrics
Engagement Rate: Starts vs. completions.
Conversion Rate: Visitors to MQLs/SQLs.
Pipeline Impact: Revenue influenced by interactive interactions.
ROI Calculation: (Revenue – Total Cost) / Total Cost, inclusive of development and promotional spends.
Designing with User Experience in Mind
- Keep It Concise
Quiz Length: 5–7 questions maximum.
Calculator Inputs: No more than 4–5 data points to minimize friction. - Mobile-First & Responsive
Fact: Over 55% of B2B emails are opened on mobile (Litmus, https://www.litmus.com/).
Best Practice: Large tap targets, simplified layouts, and conditional logic to skip irrelevant questions. - Visual Branding & Clarity
Use company colors, icons, and consistent typography.
Highlight progress bars and clear “Next” buttons to set expectations. - Explicit Value Proposition
Pre-Engagement: In email copy or ad creative, promise a tangible outcome—“Discover your carbon footprint reduction in 60 seconds.”
In-Asset: Display headlines like “Your Personalized Report Awaits” to motivate completion. - Privacy & Accessibility
GDPR/CCPA Compliance: Provide brief privacy notices and easy opt-out links.
Accessibility: Use alt text for interactive elements, high-contrast colors, and ensure keyboard navigation.
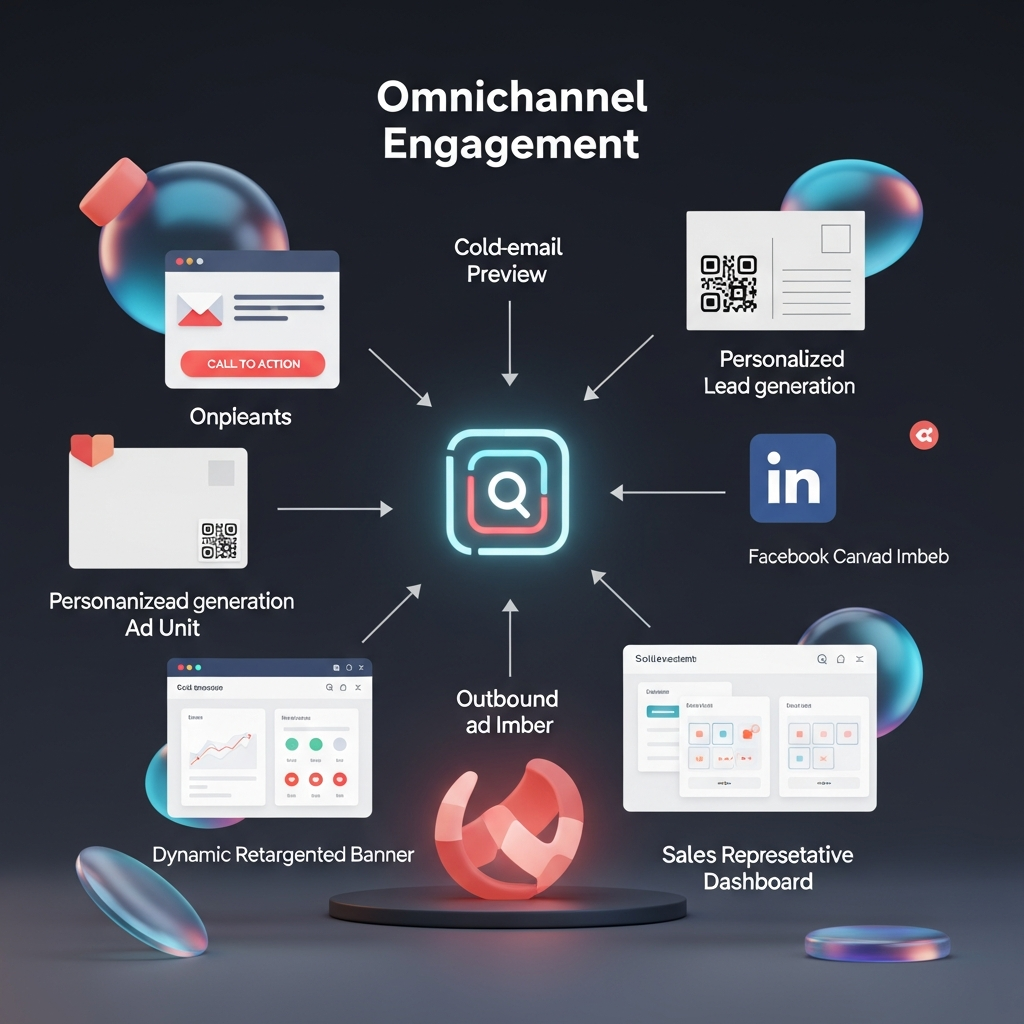
Channel Integration: Orchestrating Multi-Touch Engagement
- Cold Email Campaigns
Teaser Snippet: Embed a static image of the quiz with a prominent CTA button—“Take the 3-Minute ROI Quiz.”
Follow-Ups: Send automated reminders to non-respondents at 3-day intervals. - Direct Mail with QR Codes
Personalized Postcards: Front side poses a micro-survey question; back side contains a unique QR code linking to the full interactive survey.
Tracking: Use dynamic URLs to attribute responses back to specific campaigns. - Paid Social & Display Ads
LinkedIn Lead Gen Forms: Offer a micro-assessment directly within the ad unit.
Facebook Canvas Ads: Embed a short quiz that runs entirely in the News Feed without leaving the platform. - Retargeting & Remarketing
Dynamic Retargeting: Serve ads featuring the calculator or infographic to users who visited but did not convert.
Sequenced Ads: Show a testimonial video as the second touch after quiz completion. - Sales Enablement
Personalized Outreach: Equip reps with each prospect’s quiz or calculator results to reference in cold calls and LinkedIn messages.
CRM Integration: Automatically log responses in Salesforce or Dynamics 365 and trigger tasks for follow-up.
Automation & Personalization Workflows
- Lead Scoring & Routing
Trigger: A quiz score above 80% flags a “Hot Lead” and notifies sales via Slack or MS Teams.
CRM Action: Push all response fields into custom lead fields for segmentation. - Dynamic Email Nurture Tracks
Branch A: Low-scoring prospects receive educational eBooks and blog posts.
Branch B: High-scoring prospects get case studies, demo invites, and sales outreach within 48 hours. - Personalized Content Blocks
Use merge tags to reference quiz results or poll choices in subsequent emails: “Based on your ROI score of 75%, here’s how you can boost conversion by another 10%.” - Real-Time Alerts & SLA Monitoring
Integrate with sales engagement platforms (Outreach, SalesLoft) to ensure high-value prospects are contacted within a defined SLA (e.g., 1 business hour).
Measuring Success & Continuous Optimization
- Engagement Metrics
Start Rate: % of recipients who clicked into the asset.
Completion Rate: % who finished the quiz or calculator. - Behavioral Analytics
Time on Asset: Average duration to completion.
Drop-Off Points: Identify which questions or steps cause abandonment and iterate. - Conversion & Pipeline Impact
MQL/SQL Rates: Percentage of engaged users who become qualified leads.
Revenue Attribution: Use marketing attribution models (first touch, multi-touch) to quantify influenced revenue. - ROI Analysis
Formula: (Revenue Influenced – Total Cost) / Total Cost.
Components: Development, licensing fees, promotional spend, personnel hours. - A/B & Multivariate Testing
Variables: Quiz length, question order, CTA text, button color, and imagery.
Cadence: Run continuous tests and implement winning variations every 4–6 weeks.
Compliance and Ethical Considerations
- Privacy Regulations
GDPR (EU): Offer clear consent checkboxes and data deletion options.
CCPA (California): Disclose data collection purposes and sale rights. - Data Security
Encryption: Use HTTPS/TLS for all asset pages.
Storage: Keep data on secure, SOC 2–compliant servers. - Ethical Use
Minimal Data Collection: Only ask for what’s essential.
User Rights: Provide clear instructions to access, correct, or remove personal data.
Conclusion and Next Steps
Interactive content elevates outbound marketing from noise to meaningful conversation. By combining a solid understanding of engagement psychology, meticulous planning, user-centric design, omnichannel distribution, automated personalization, rigorous measurement, and strict compliance, you can transform static campaigns into memorable experiences. Start by piloting one simple asset—perhaps a 5-question ROI calculator or a short maturity assessment—for a target segment. Track how it performs, iterate based on data, and gradually expand your interactive arsenal. The future belongs to marketers who convert passive outreach into dynamic dialogue—embrace interactivity today and watch your engagement, pipeline, and revenue soar.